Picture this.
You own 300 commercial buildings. Together, they’re worth $6 billion. A pension fund is counting on you to know – at any moment – not just how the portfolio is performing, but why. And what you’re doing about it.
That’s not a data problem. That’s a scale problem.
Every building is essentially a small city. It has tenants, operating costs, market pressures, capital needs, and a story. Multiply that by 300, and the volume of information becomes almost impossible to manage – let alone explain – with any clarity or confidence.
The industry knows this. And it has spent decades trying to fix it: ERP systems, data warehouses, BI platforms, and now AI tools that can read a lease or summarize a document in seconds.
But here’s what all of those solutions have in common: they solve a piece of the problem.
What they don’t do is connect the numbers to the narrative – at scale, across an entire portfolio, within a single operating environment that your finance team can actually use.
What we see at Refined Data looks something like this:
A VP Finance receives a quarterly investor report request. The financial data lives in Yardi. The variance explanations live in forty different property manager inboxes. The assumptions and context live in someone’s head. The prior quarter’s narrative is buried in a shared drive.
Assembling that report takes weeks. It’s manually intensive, error-prone, and almost impossible to do consistently across a large portfolio. And the moment it’s done, the process starts again.
AI won’t fix this on its own. Neither will another reporting tool or a smarter dashboard.
What’s missing is an operating layer that connects enterprise financial data with the human judgment, context, and narrative that gives those numbers meaning – and makes that connection repeatable, across every asset, every quarter.
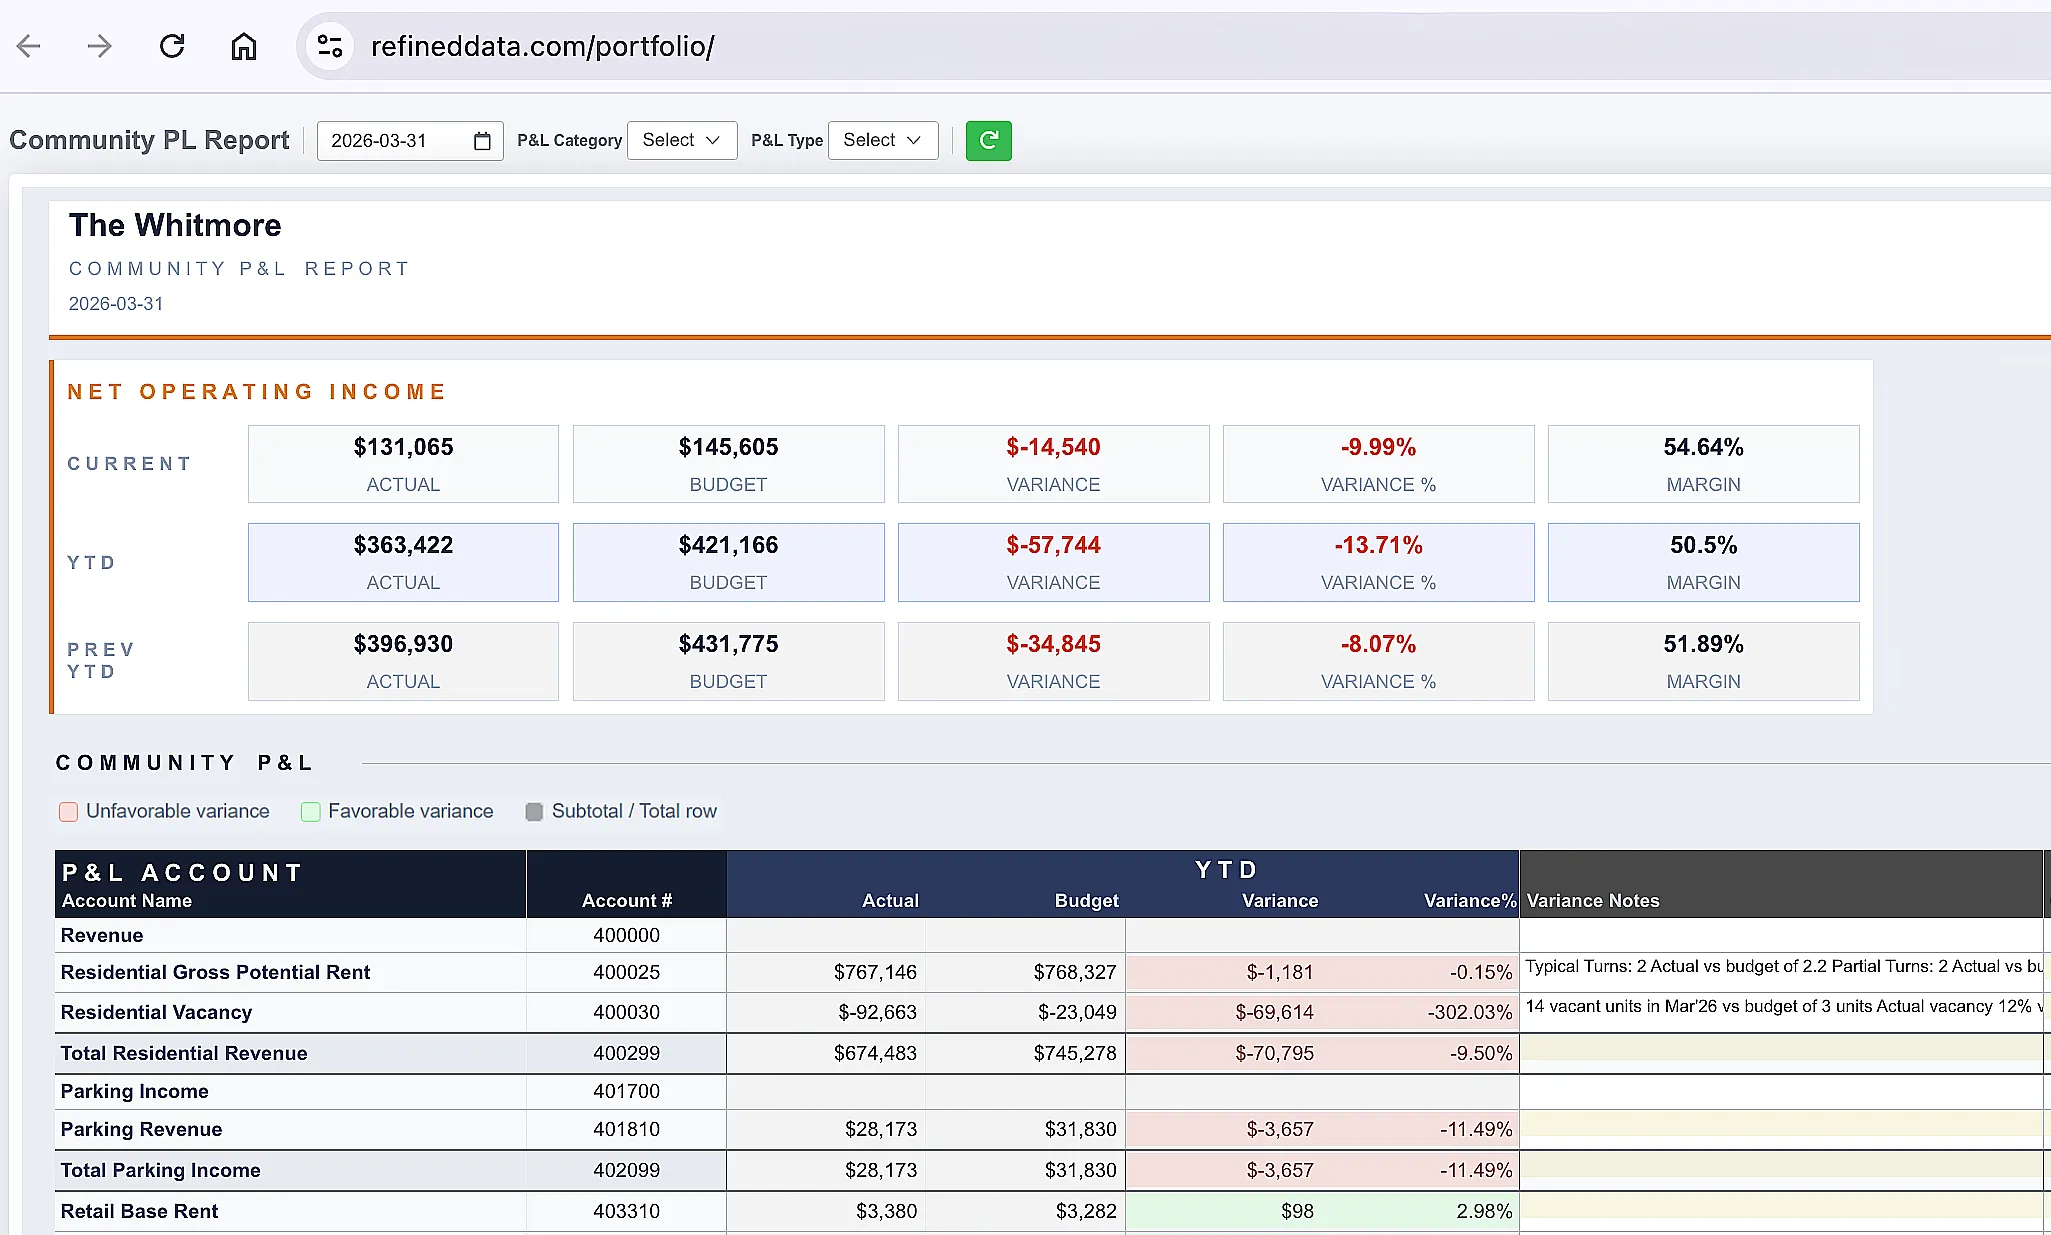
The above image shows what this looks like in practice: a financial variance analysis that pulls actuals directly from Yardi or MRI, and pairs them with narratives collected from the people closest to each asset – all within a single, structured workflow.
That’s not a reporting tool. It’s not a spreadsheet replacement. It’s the layer that sits between the data and the decision – and makes both better.
The real estate industry is extraordinarily good at acquiring assets and managing risk. What it hasn’t been able to do – at scale, without enormous manual effort – is turn the performance of those assets into a clear, trusted, investor-grade story. Consistently. Efficiently. Quarter after quarter.
That’s the problem Refined Data was built to solve.